
Think of a business report format as the architectural plan for your ideas. It gives your information a solid foundation, making the final document professional, easy to navigate, and, most importantly, persuasive. This structure isn't just about looking good; it’s about making sure your key insights land with maximum impact.
The standard framework usually includes a title page, executive summary, introduction, the main body, a conclusion, and any appendices. It's a proven path to guide your reader from the "what" to the "so what."
The Blueprint for a Powerful Business Report
Have you ever tried to assemble a complex piece of furniture without the instructions? You've got all the pieces scattered around, but no clear path forward. A business report without a solid format is exactly like that—a jumble of data and ideas that fails to tell a clear, compelling story.
The standard format is your instruction manual. It transforms raw information into a powerful tool that helps leaders make smart decisions. This isn't about blindly following rules; it’s about understanding the psychology of your reader.
Executives and key stakeholders are busy. They need to grasp the critical information, follow your analysis, and understand your recommendations without getting bogged down in a maze of text. A logical flow respects their time and instantly builds your credibility.

Why a Standard Format Matters
Sticking to a recognized format does more than just organize your thoughts—it’s a signal of professionalism that makes your findings more powerful. The benefits are clear:
- Boosts Clarity: A predictable structure makes it easy for readers to follow your train of thought from problem to solution.
- Improves Readability: Clear headings and a logical sequence let people scan the document and find the exact information they need in seconds.
- Builds Credibility: A well-formatted report shows you've been thorough and careful, which makes your conclusions far more believable.
- Makes Communication Efficient: It puts the most important information first, usually in an executive summary, giving readers the big picture before they dive into the details.
This structured approach has become the standard in corporate reporting worldwide, shaped by the expectations of everyone from regulators to investors. For context, research-heavy reports in large corporations can often exceed 30 pages, while marketing reports are usually kept to a punchier 8–12 pages to help drive faster decisions.
A well-structured report acts as a silent guide for your reader. It anticipates their questions and presents answers in a logical sequence, building a compelling case for your conclusions without them ever feeling lost.
Let's break down the essential components that make up this blueprint. The table below gives you a quick overview of what each section does and what it needs to contain.
Key Components of a Standard Business Report
| Section | Primary Purpose | Key Content |
|---|---|---|
| Title Page | To provide essential identifying information at a glance. | Report title, author's name, company, and submission date. |
| Executive Summary | To offer a complete, high-level overview of the entire report for busy readers. | A brief of the problem, key findings, and major recommendations. Can be read as a standalone document. |
| Introduction | To set the stage and provide context for the report. | The purpose of the report, the problem being addressed, and the scope of the investigation. |
| Body | To present the detailed analysis, findings, and supporting data. | Data, analysis, charts, graphs, and the logical arguments that support your conclusions. |
| Conclusion | To summarize the key findings and tie everything together. | A restatement of the main points and what they mean collectively. No new information should be introduced here. |
| Recommendations | To propose specific, actionable steps based on the conclusion. | Clear, specific suggestions on what should be done next, by whom, and why. |
| Appendices | To provide supplemental information that is too detailed for the main body. | Raw data, detailed charts, interview transcripts, or related documents. |
Mastering this structure is the first step. To really see how these principles work in practice, it’s helpful to explore real-world examples, like looking at resources on mastering financial reporting in Excel. Seeing how formatting works in a specific field like finance can deepen your ability to build effective reports for any business need.
Building Your Report Section by Section
Okay, you've got your blueprint. Now it's time to actually build this thing. Think of each section of your report as a crucial step in a logical argument. Each piece needs to connect cleanly to the next, creating a structure that's not just solid, but persuasive. This is where we bring the standard business report format to life and turn a pile of data into a story that makes sense.
Let's get practical and break down how to craft each part for maximum impact. A great report doesn't just present information; it guides your reader on a journey, from the 30,000-foot view right down to the nitty-gritty details, making sure your message lands exactly as you intended.
The Executive Summary: The 60-Second Pitch
Let’s be honest: the executive summary might be the only part of your report that a busy decision-maker reads. It's not a warm-up or an introduction; it's the whole story in miniature. You need to deliver the problem, your most important findings, and your core recommendations right up front.
Here’s the trick: write it last. Only after you’ve wrestled with all the data and finalized your conclusions can you really boil it down to its potent essence. Be ruthless. Be brief. If someone only reads this single page, they should still walk away knowing exactly what you found and what they need to do about it.
The best executive summaries stand on their own. They give a leader enough context and insight to make a smart decision without ever flipping to page two. Think of it as your entire argument, delivered in a snapshot.
The Body: Crafting a Logical Flow
The body of the report is where you lay out your evidence and walk the reader through your thinking. The absolute key here is organization. Nobody wants to read a wall of text. Use clear, descriptive headings and subheadings to break your analysis into logical, bite-sized chunks.
Structure each part of the body to build on the one before it. You might start by explaining how you got your data (your methodology), then present the findings themselves (with clear charts and graphs), and follow up with your interpretation of what it all means. This step-by-step approach keeps your reader from getting lost and helps them see exactly how you reached your conclusions.
Building a persuasive case is a skill that extends beyond just reports. For example, a founders' guide to creating pitch decks that close deals shows how sequencing your information is critical to winning people over—a lesson that applies perfectly here.
The Conclusion and Recommendations: Driving Action
This is where the rubber meets the road. Your conclusion and recommendations are the final, powerful one-two punch of your report. They are separate sections, but they work together.
-
The Conclusion: This is your "in a nutshell" summary. You're simply restating the most critical takeaways from your analysis. The golden rule here? Never introduce new information. The conclusion is about reinforcing what the reader has already learned, not surprising them with something new.
-
The Recommendations: Now you pivot from "what we found" to "what we should do." This is where you translate insight into action. Vague suggestions like "we should improve marketing" are a complete waste of time. Your recommendations need to be concrete, measurable, and actionable.
Here’s what a strong recommendation looks like:
- Be Specific: Don't say "increase social media presence." Say "Launch a targeted Instagram campaign for Product X in Q3."
- Assign Ownership: Who's on the hook for this? "The marketing team, led by Jane Doe, will manage the campaign."
- Provide Rationale: Give the "why" in one sentence. "Our recent survey showed the 18-25 demographic has the highest purchase intent, and Instagram is their primary platform."
When you meticulously build out each part of your report like this, you’re creating more than a document. You're forging a powerful tool for clear communication and confident decision-making.
Choosing the Right Report Format for Your Goal
Think of a business report format as the right tool for a specific job. You wouldn't use a sledgehammer to hang a picture frame, right? In the same way, you shouldn't cram a quick weekly update into the same dense format you'd use for an in-depth market analysis. The structure you choose has a huge impact on how your message lands and, ultimately, whether it gets people to act.
Making a smart choice upfront is what separates a report that gets read from one that collects dust. It's a strategic decision that should be guided by two simple things: what you want to achieve and who's going to be reading it.
This decision tree breaks it down, helping you pick the right path by asking a few key questions about your goal, your audience, and whether you need to offer recommendations.
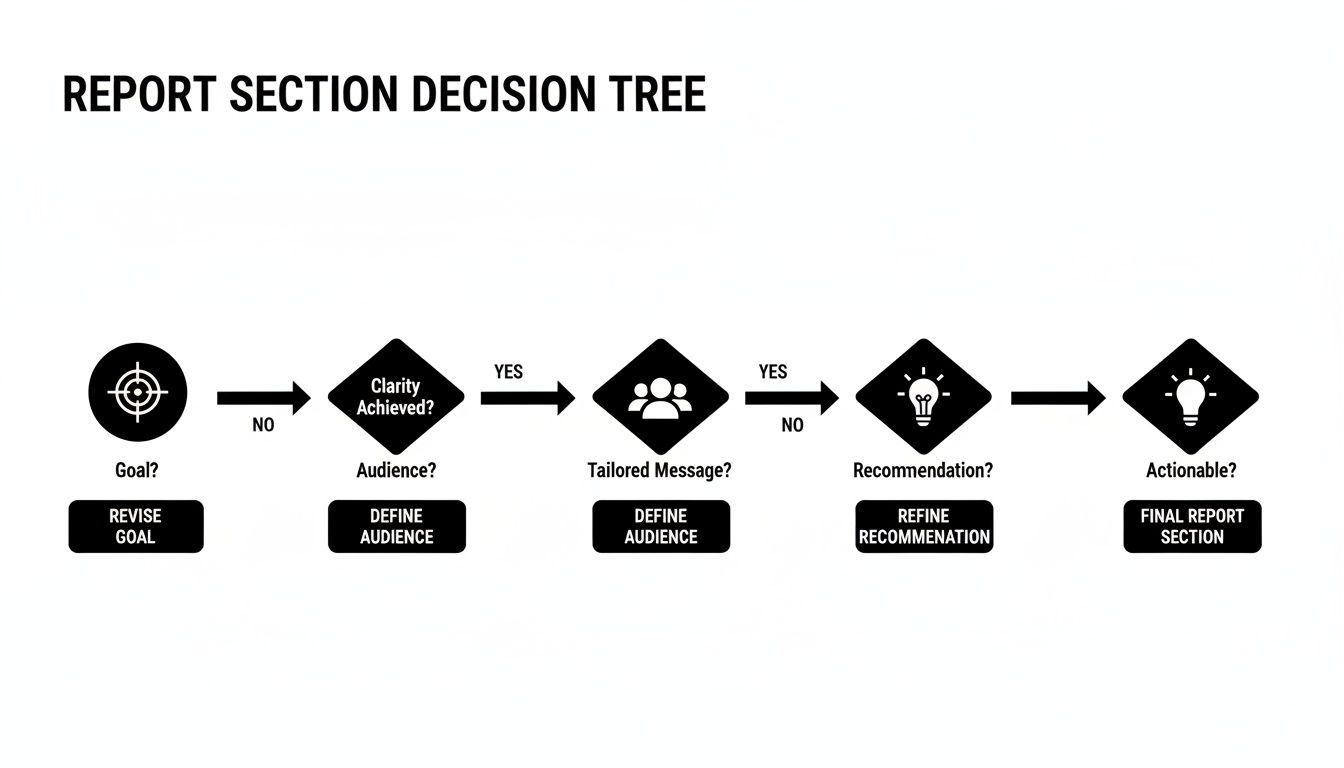
As you can see, everything starts with your purpose. That single point determines how simple or complex your report needs to be to get your findings across clearly.
Matching Format to Function
To nail this, you need to know the core types of business reports and what each one is really for. They aren't interchangeable. Each format serves a very different function, from simply laying out the facts to interpreting complex data to drive massive decisions.
Let's break down the most common formats you'll run into:
- Informational Reports: These are the most basic and objective. Their job is just to present the facts—no opinions, no analysis. Think of things like your weekly progress updates, meeting minutes, or expense reports.
- Analytical Reports: This is where you go a level deeper. An analytical report doesn't just show the data; it interprets it to draw conclusions or solve a specific problem. Feasibility studies, market trend analyses, and "why did sales dip last quarter?" reports all fit here.
- Research Reports: These are the heavy hitters. They deliver brand-new information discovered through a formal investigation. You'll see a detailed methodology, the raw findings, and conclusions that often add new knowledge to the company's strategy.
- Proposal Reports: This format is all about persuasion. You've identified a problem or a golden opportunity, and this report makes the case for a specific solution. It outlines the plan, the costs, and the expected benefits to get a "yes" from decision-makers.
Your report’s format is the vessel that carries your message. A clear, well-chosen structure ensures that message arrives intact and persuades your audience, while the wrong one can cause your key insights to get lost along the way.
Which Business Report Format Should You Use?
To help you decide at a glance, this table compares the key characteristics of each report type. Use it as a quick guide to find the best fit for your situation.
Just remember, while these are clear categories, real-world reports sometimes blend elements. A complex proposal, for example, might include a heavy dose of research and analysis.
| Report Type | Primary Goal | Best For | Audience |
|---|---|---|---|
| Informational | To present facts and data objectively. | Routine updates, meeting summaries, and documenting activities. | Internal teams, department heads. |
| Analytical | To interpret data and solve a problem. | Making decisions, comparing options, and understanding trends. | Managers, executives, stakeholders. |
| Research | To present findings from an in-depth study. | Exploring new opportunities or complex issues with data. | Senior leadership, expert panels. |
| Proposal | To persuade the reader to approve a project. | Securing funding, launching new initiatives, or solving a problem. | Decision-makers, clients, investors. |
The key is to start with the primary goal. Once you know if you're informing, analyzing, researching, or persuading, picking the right framework becomes much easier.
Formatting Tips That Signal Professionalism
You can have the most brilliant analysis in the world, but if it's trapped in a wall of text, it might as well not exist. The way you format your business report does more than just make it look good; it shows you respect your reader's time and gives your findings the professional credibility they deserve.
Think of it this way: formatting is the handshake of your report. A clean, organized layout tells your audience that you’re thorough, detail-oriented, and that the information inside is worth their attention. It turns a dense document into something inviting and easy to navigate.

Creating a Clean and Readable Layout
The first step is building a clear visual roadmap for your reader. Headings and subheadings are your signposts, breaking up long sections and making the document scannable. If someone only has 30 seconds, they should be able to grasp the main points just by reading the headings. Consistency is everything here.
Stick with professional, no-nonsense fonts. You can't go wrong with classics like Calibri, Arial, or Times New Roman, typically in a 10- to 12-point size. They're standard for a reason: they get the job done without distracting from your message. White space is your best friend—generous margins and breathing room between paragraphs keep the page from feeling cluttered and overwhelming.
Good formatting is invisible. It works quietly in the background, guiding the reader’s focus to your analysis and recommendations without calling attention to itself. When done right, the reader simply feels that the report is clear and easy to understand.
Here are a few non-negotiable rules to live by:
- Use Consistent Headings: Your H2, H3, and H4 styles should look the same from the first page to the last.
- Maintain Simple Fonts: Pick one or two professional fonts and stick with them. This isn't the place for creative expression.
- Align Text to the Left: For reports, left-aligned text is the gold standard for readability.
- Number Your Pages: It’s a small detail that makes a huge difference when you need to say, "Let's all turn to page 12."
Using Visuals to Tell a Story
Charts, graphs, and tables aren't just filler—they're your most powerful storytelling tools. In a world drowning in data, visuals cut through the noise and make complex information digestible. For instance, experts in analytics and design often build performance reports around charts, using them as the primary format to convey insights. This is because a line chart showing a trend or a bar chart comparing categories tells a story far quicker than a paragraph ever could. This visual-first approach, where text supports the graphics, is a hallmark of high-impact industry reports. You can explore more about this in this guide to effective trend reporting on contentsquare.com.
But you have to choose the right tool for the job:
- Line Charts: Perfect for tracking performance or showing trends over time.
- Bar Graphs: The best way to compare distinct groups or categories side-by-side.
- Pie Charts: Use these sparingly, but they are great for showing percentage breakdowns or parts of a whole.
Every single visual needs a clear title and labels. Your goal is for the reader to glance at the chart and get the main idea instantly, without having to hunt for context.
Common Report Writing Mistakes to Avoid
Knowing what not to do is often just as crucial as knowing what to do. Even a fantastic, well-researched report can completely miss the mark if it's full of common mistakes that kill its credibility. These little slip-ups can easily confuse your audience, bury your best insights, and stop your recommendations dead in their tracks.
Think of this as your pre-flight checklist. Once you learn to spot these frequent pitfalls, you can review your own work with a critical eye and make sure the final version is clear, persuasive, and professional.
Burying the Lead
This is probably the biggest and most common mistake. Don't force your reader to go on a treasure hunt for the main point. Executives and decision-makers are incredibly busy; they don't have time to wade through pages of background info to find out what you’re trying to say.
Your most critical findings and recommendations need to be right up front, especially in the executive summary.
A great report respects the reader's time. It delivers the essential takeaways immediately, then uses the rest of the document to provide the supporting evidence. Never make your main point a surprise at the end.
Using Vague Language and Jargon
Clarity is everything in a business report, and ambiguity is your worst enemy. Phrases like "improve operational synergy" or "leverage key assets" might sound impressive, but they mean very little without concrete details. The goal is to be understood instantly, not to sound like a business school textbook.
On a similar note, be ruthless about cutting out industry jargon unless you are 100% sure every single person reading it knows exactly what it means. If you absolutely must use a technical term, just add a quick, simple definition the first time you use it.
Presenting Data Without Context
Numbers don't speak for themselves—they need you to tell their story. Just dropping a chart or a statistic into your report without explaining what it means is a huge missed opportunity. Your job is to connect the dots for the reader and show them why that number matters.
Here are a few simple ways to give your data some much-needed context:
- Compare to Previous Periods: How do this quarter's sales stack up against last quarter's?
- Benchmark Against Goals: Did you hit, miss, or exceed your target?
- Explain the "Why": What market forces or internal decisions led to this result?
The bar for this is getting higher all the time. Today’s business report format is heavily influenced by global research standards, where just stating a conclusion isn't good enough anymore. A credible report must clearly outline its methodology, sample sizes, and geographic scope. Even as AI helps with drafting, it’s the human touch that preserves these structural details and aligns the report with how leaders actually think and evaluate information. For a deeper dive into these evolving standards, you can read more about modern business analysis and research on iiba.org.
Your Top Report Formatting Questions, Answered
Even when you know the ropes, a few tricky questions always pop up when you're deep in the writing process. Let's tackle some of the most common ones I hear so you can button up your report and send it off with confidence.
How Long Should a Business Report Be?
Honestly, there's no magic number. The right length is whatever it takes to get the job done for your specific audience. Think about it: a quick weekly update for your team might just be a one-pager, while the big annual financial report for shareholders will naturally be much heftier.
The real goal is to be as concise as you can without leaving out crucial information. Clarity and impact always trump word count. Remember, your executive summary is your heavy hitter—it needs to give busy leaders the bottom line, whether the full report is 5 pages or 50.
What’s the Difference Between a Formal and an Informal Report?
The biggest difference comes down to structure, tone, and who you're writing for. It’s all about matching your communication style to the situation.
- Formal Reports: These are the big, buttoned-up documents—think in-depth research studies or annual summaries. They have a strict, predictable structure with things like a title page and table of contents. The tone is always objective and professional because they're usually headed for senior management or people outside the company.
- Informal Reports: These are your everyday workhorses, like meeting notes, internal memos, or quick progress updates. They’re much simpler, the tone is more conversational, and they’re meant for your immediate team or colleagues you work with daily.
When in doubt, think about the weight of the topic and your relationship with the reader. That will tell you which way to go.
A formal report is like delivering a meticulously prepared presentation in the boardroom. An informal report is more like the quick, focused chat you have with a coworker in the hall to keep things on track.
How Do I Cite Sources in a Business Report?
Citing your sources is an absolute must. It’s how you show you’ve done your homework and build trust with your reader. The style you use—like APA, MLA, or Chicago—really depends on what your company prefers. If there's no official style guide, APA is a safe and widely respected bet in most business settings.
The most important thing? Be consistent. Whether you use footnotes or in-text citations, stick with one method from start to finish. And always, always include a full reference list or bibliography at the end. This lets your readers dig deeper into your data if they want to.
Can I Use AI to Help Write My Business Report?
Of course! AI can be a fantastic tool for getting a first draft down, summarizing dense information, or just polishing your sentences. Think of it as a helpful assistant who gets the ball rolling, but you’re still the one calling the shots and steering the project home.
The key is human oversight. You have to be the one to fact-check everything, make sure the tone sounds like you, and add the critical thinking and insights that only a person can provide. After getting a draft from AI, running it through a tool to humanize the text is a great final step. It helps smooth out any robotic language and ensures your report sounds authoritative and builds real credibility with your audience.
Are you looking to refine your AI-generated drafts into polished, professional reports? AI Busted transforms robotic text into natural, human-like writing that connects with your audience. Our platform supports honest use by helping you achieve a 100% human score, ensuring your content is clear, credible, and ready to make an impact. Try it for free and see the difference.